12 Automatically Generated Charts
All charts below were automatically generated from the Final67.bib file — a corpus of 67 scientific articles on auditing and artificial intelligence. This is exactly the output the platform produces for any .bib file.
67
Documents
239
Unique authors
56
Sources
62
Keywords
2020–2025
Timespan
3.66
Co-authors/article
 01
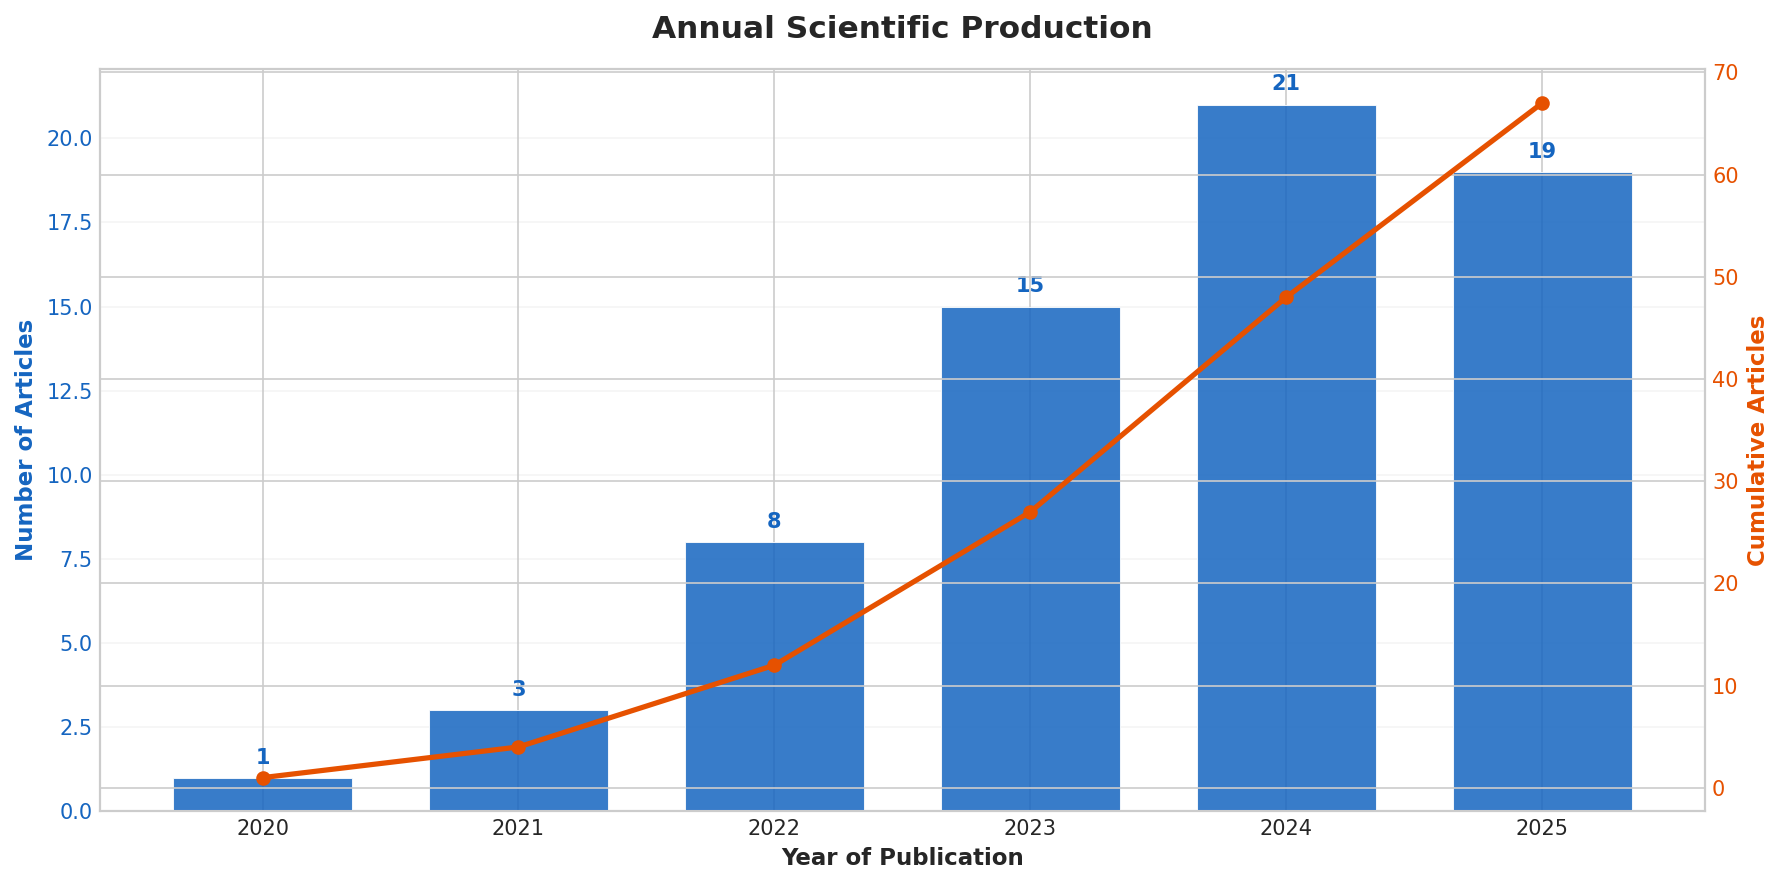
01Annual Scientific Production
DescriptivePublication volume per year across the 2020–2025 timespan, showing the temporal distribution of the 67 documents.
Download PNG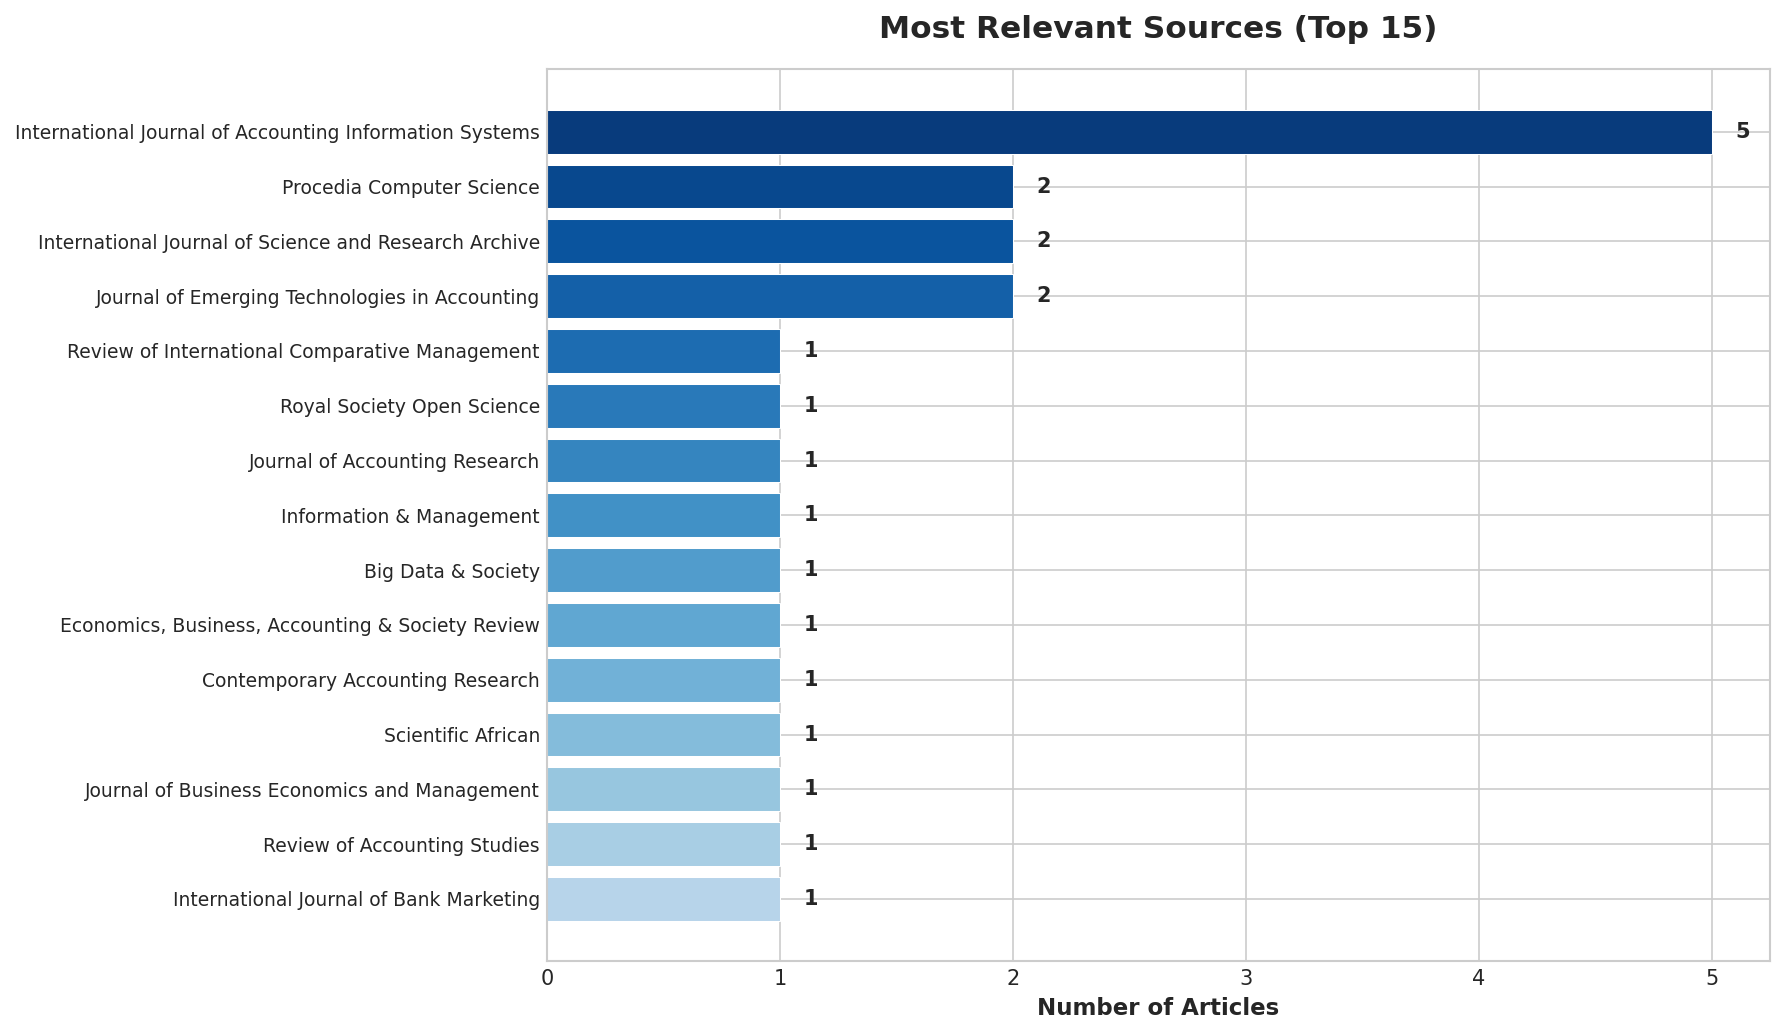 02
02Most Relevant Sources — Top 15
DescriptiveThe 15 journals and conference proceedings with the highest number of publications in the corpus (56 unique sources total).
Download PNG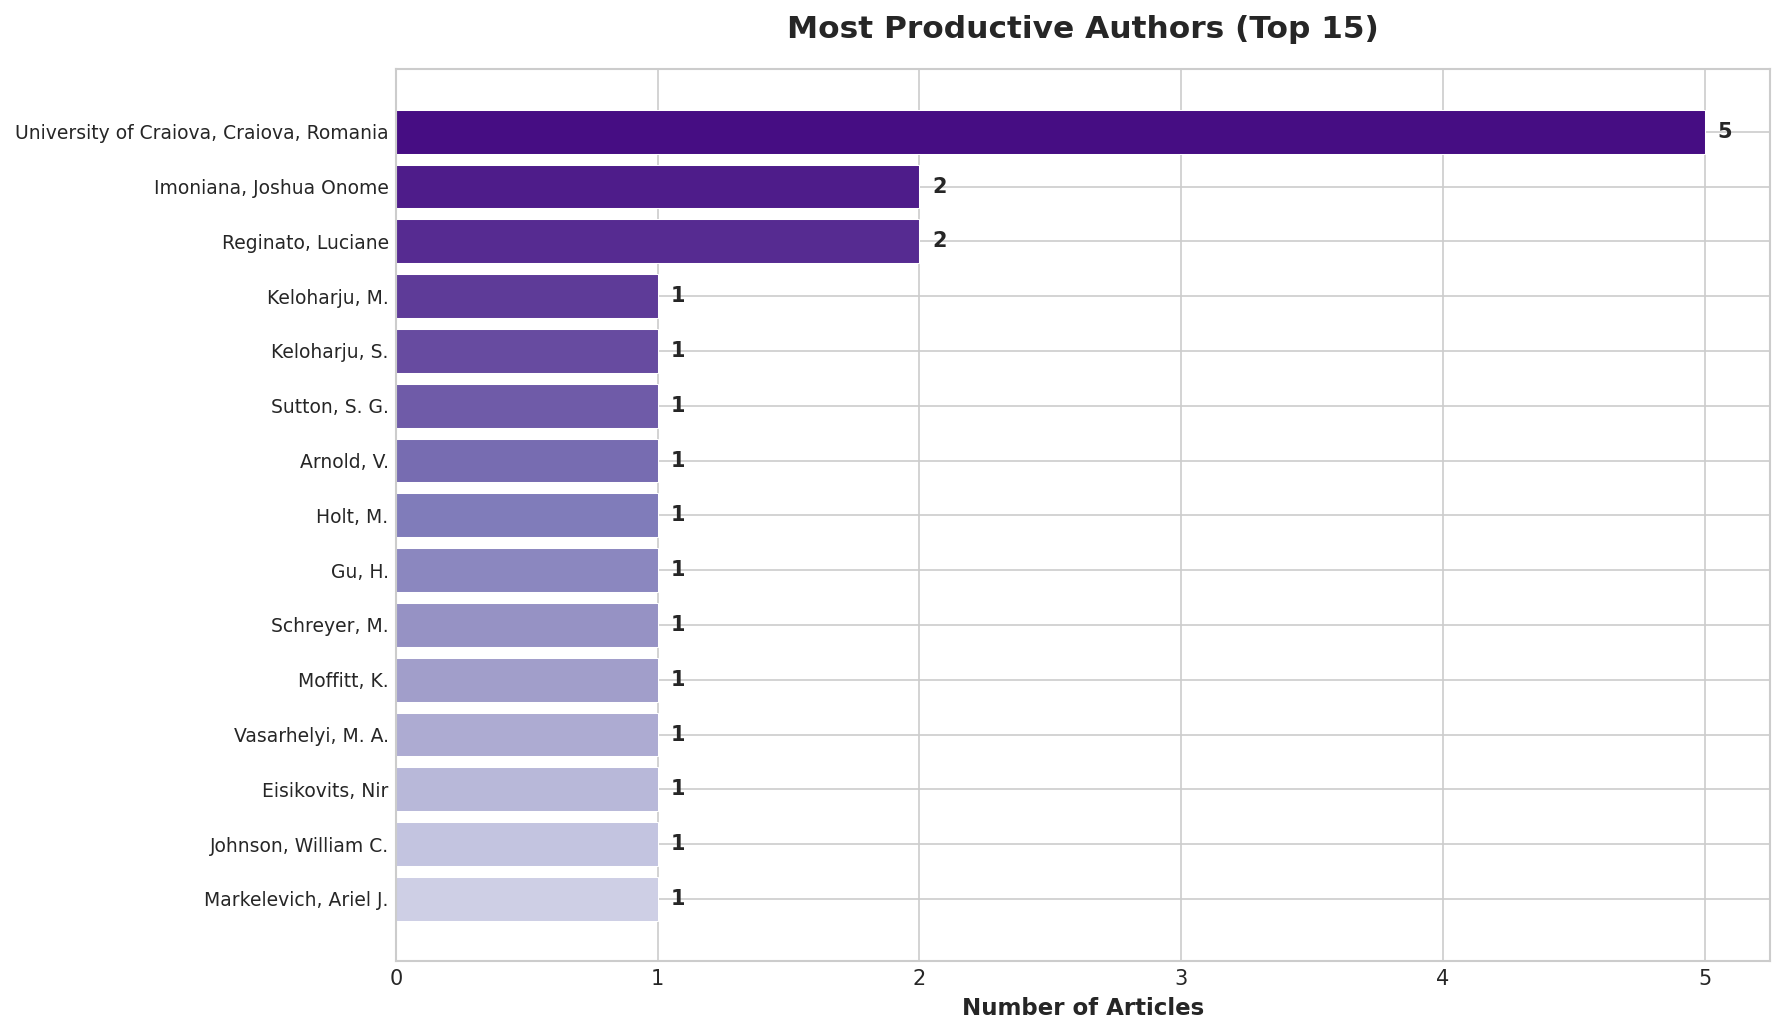 03
03Most Productive Authors — Top 15
AuthorshipAuthor productivity ranking among the 239 unique authors identified in the corpus.
Download PNG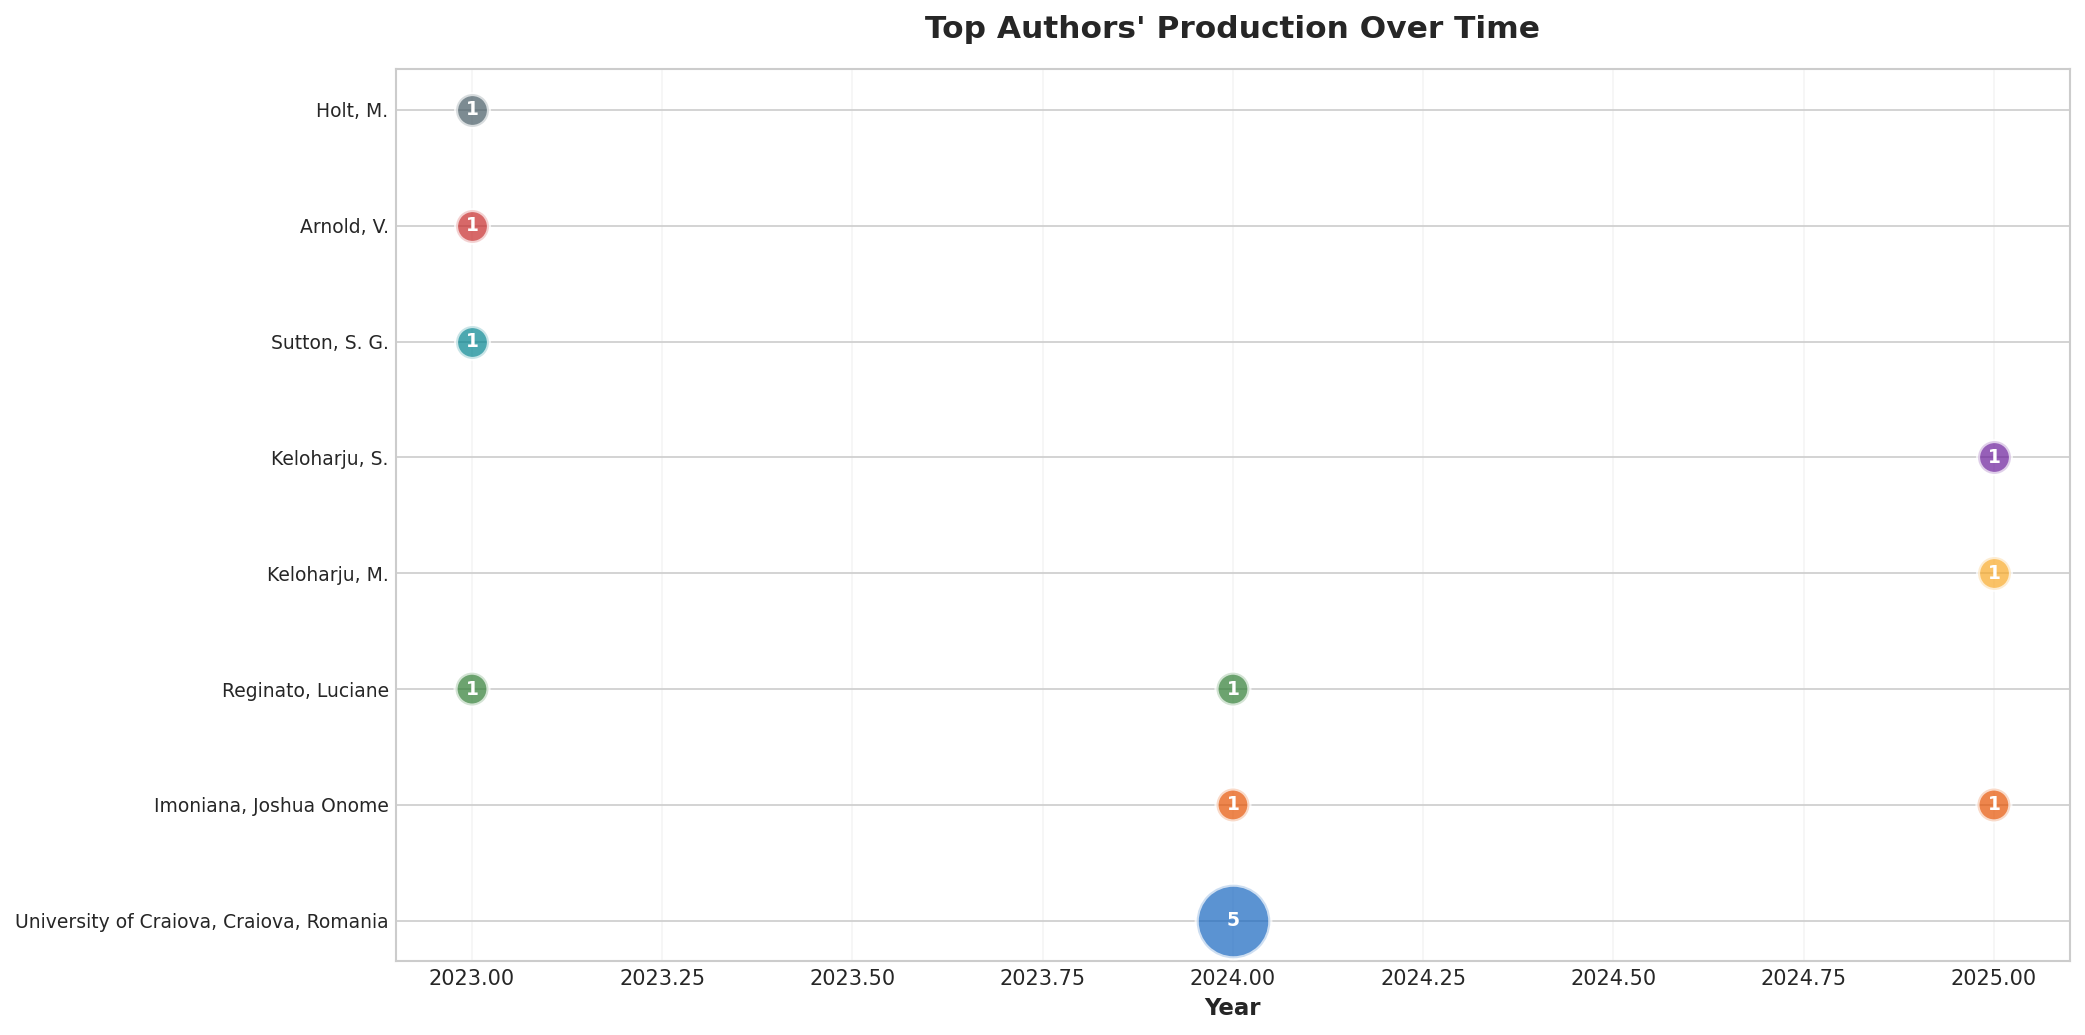 04
04Authors' Production Over Time
AuthorshipTemporal trajectory of the most productive authors, revealing continuity and emergence patterns in the research community.
Download PNG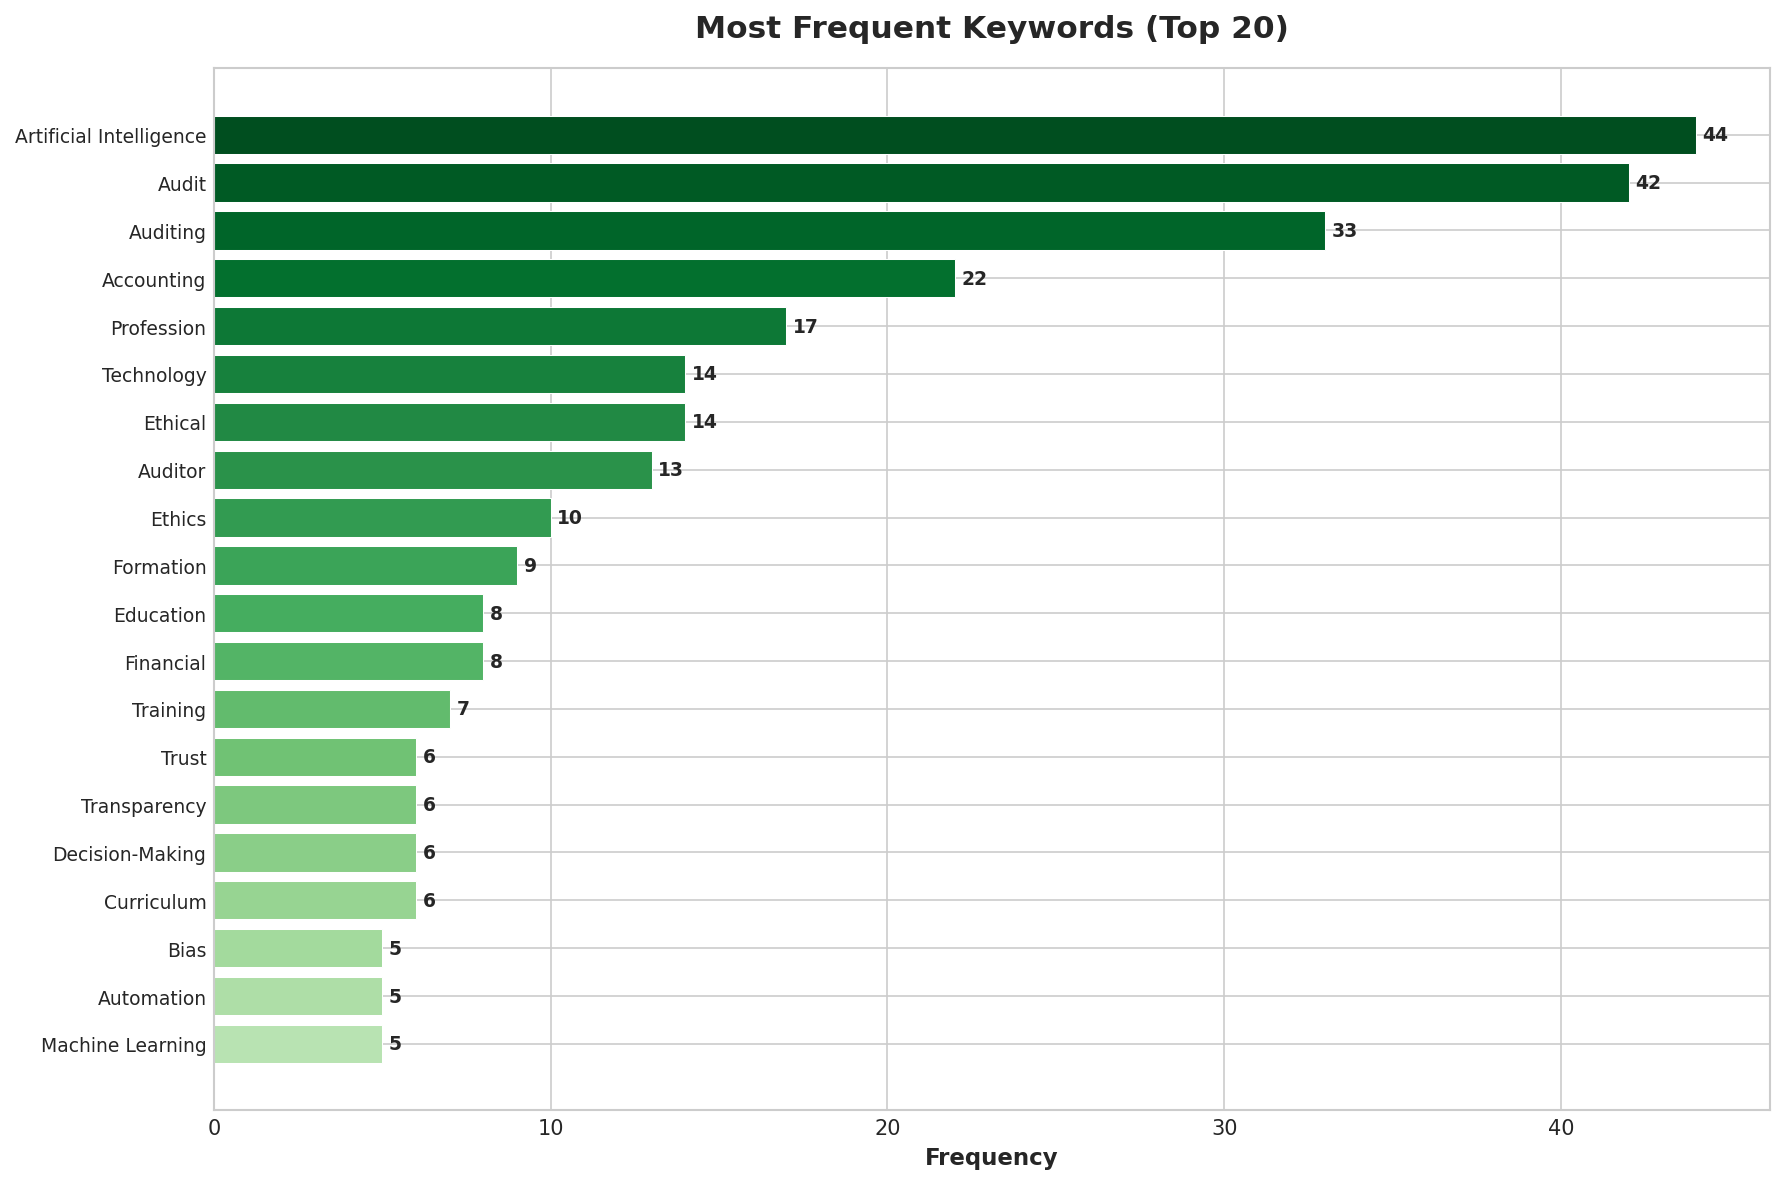 05
05Most Frequent Keywords — Top 20
KeywordsTerm frequency analysis of the 62 unique keywords extracted from titles, abstracts, and author-supplied keywords.
Download PNG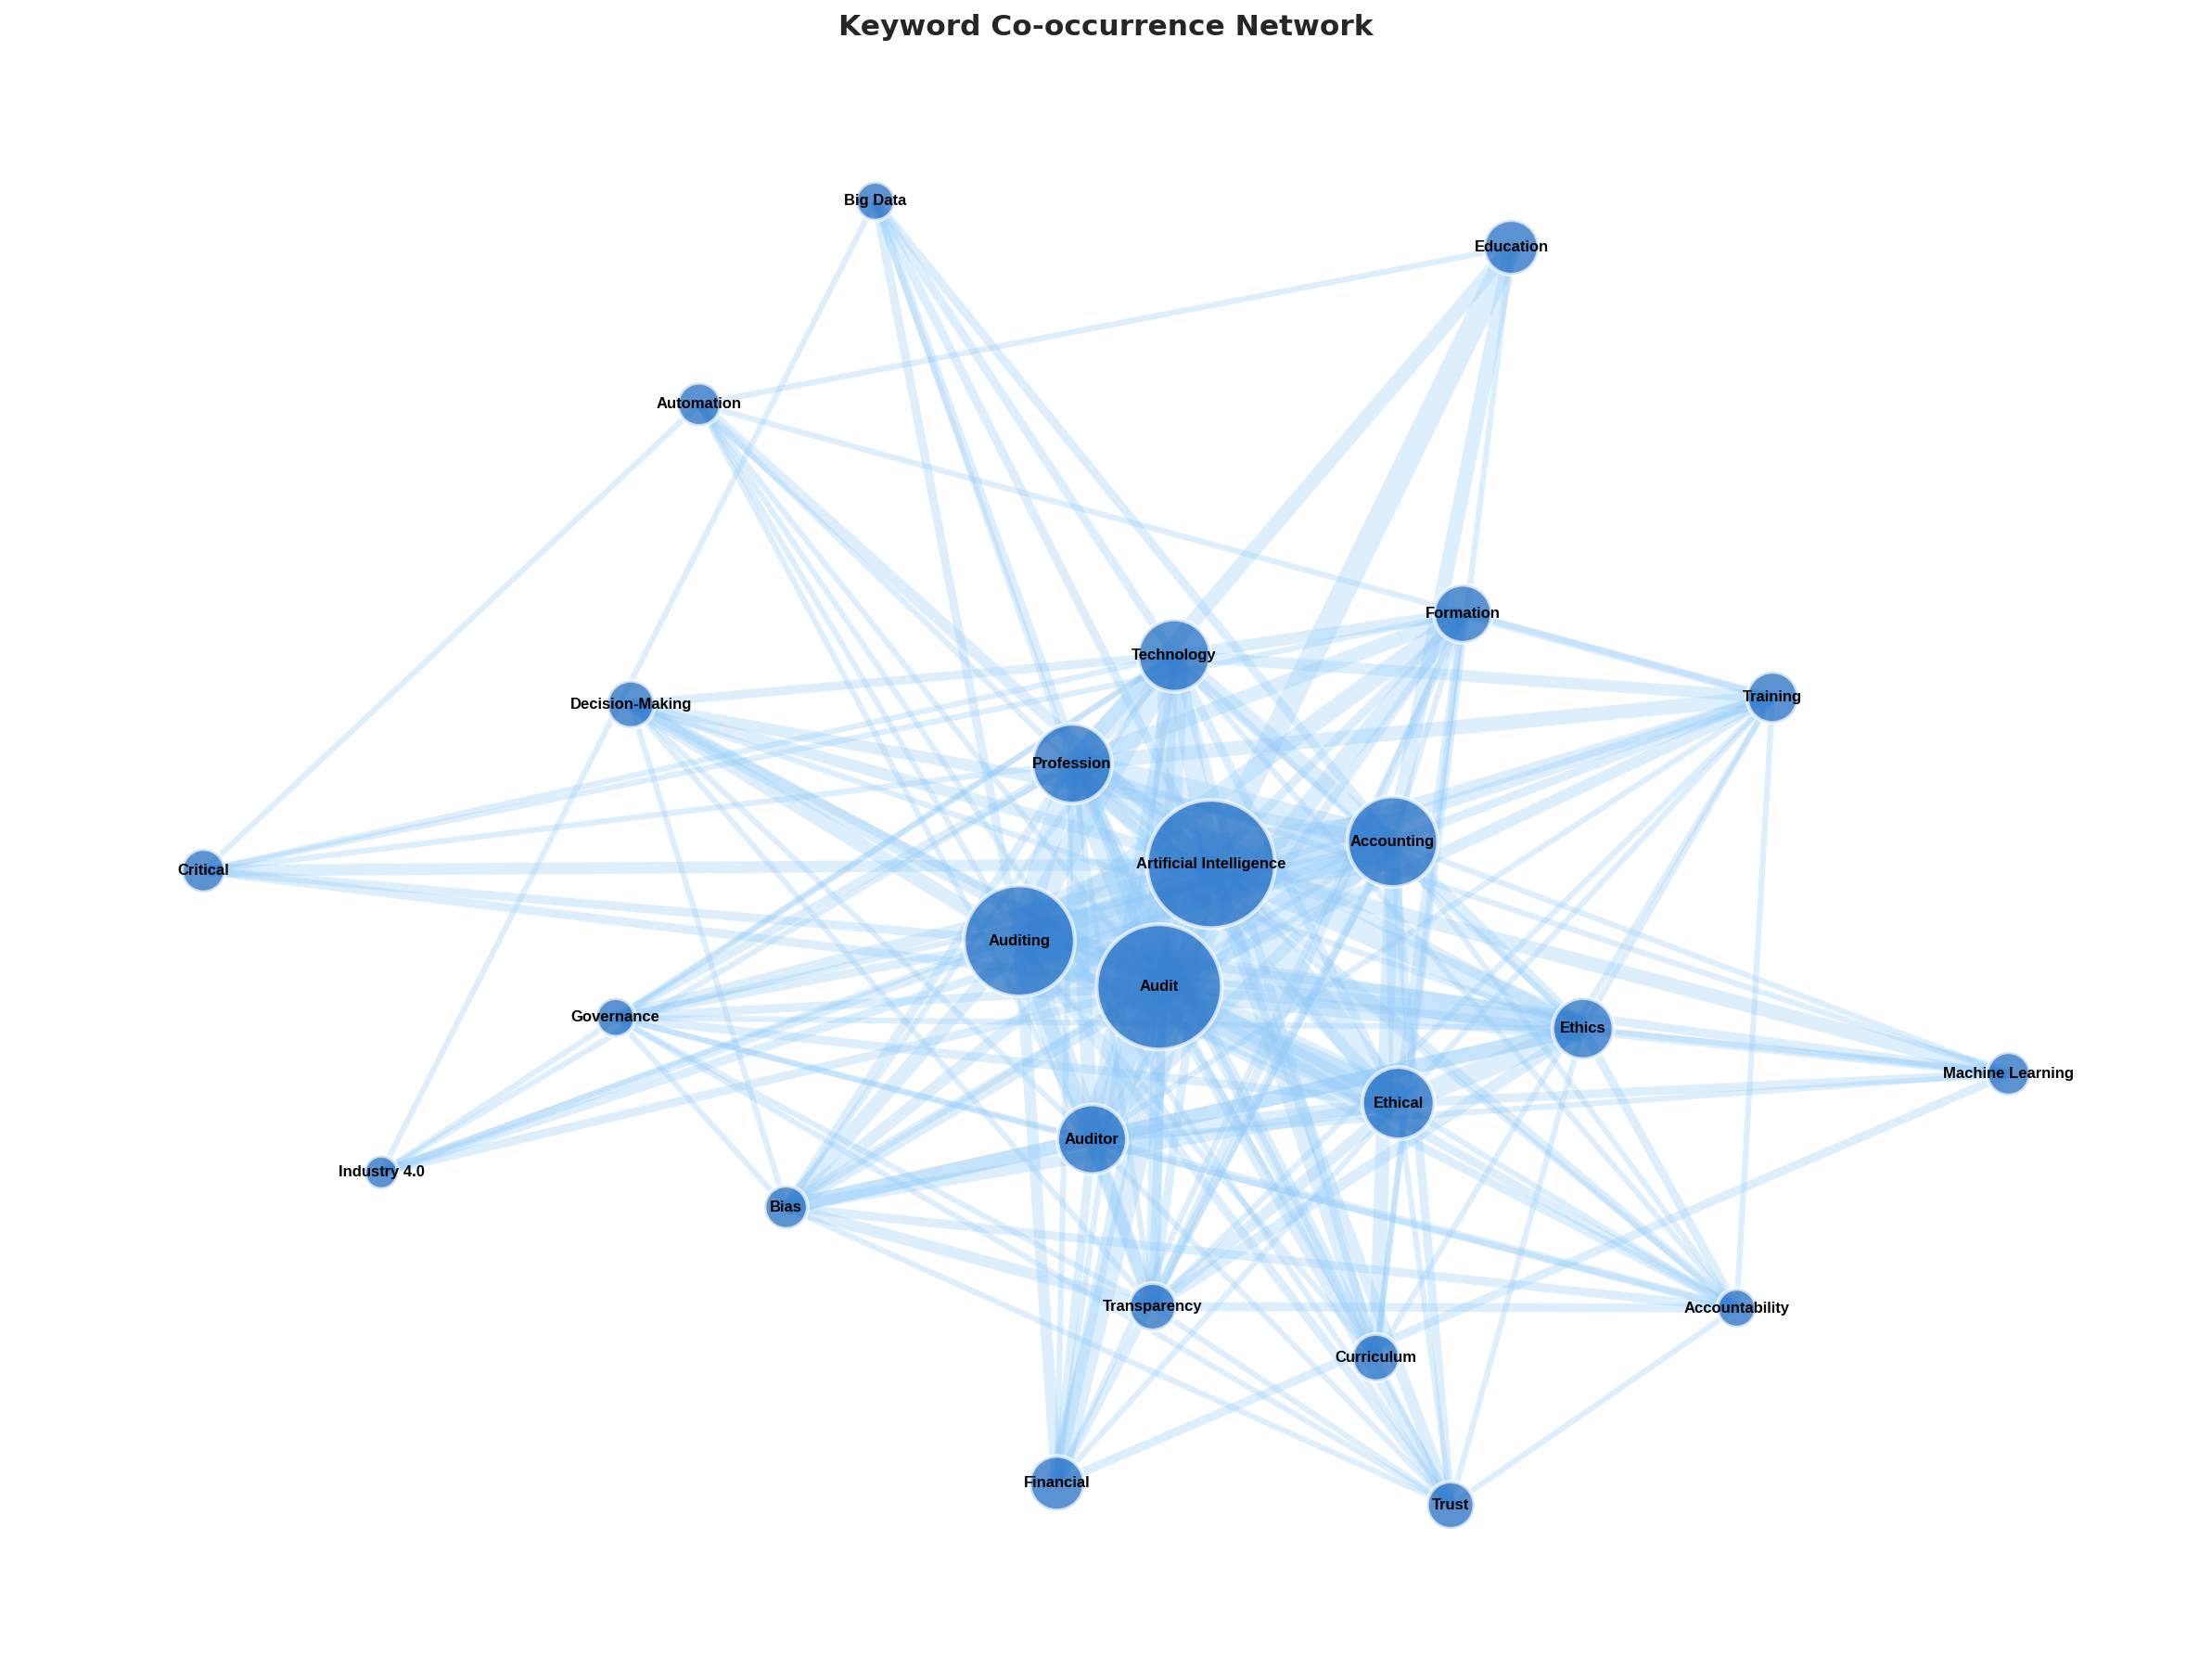 06
06Keyword Co-occurrence Network
NetworkNetwork graph mapping semantic relationships between keywords. Node size reflects frequency; edge weight reflects co-occurrence strength.
Download PNG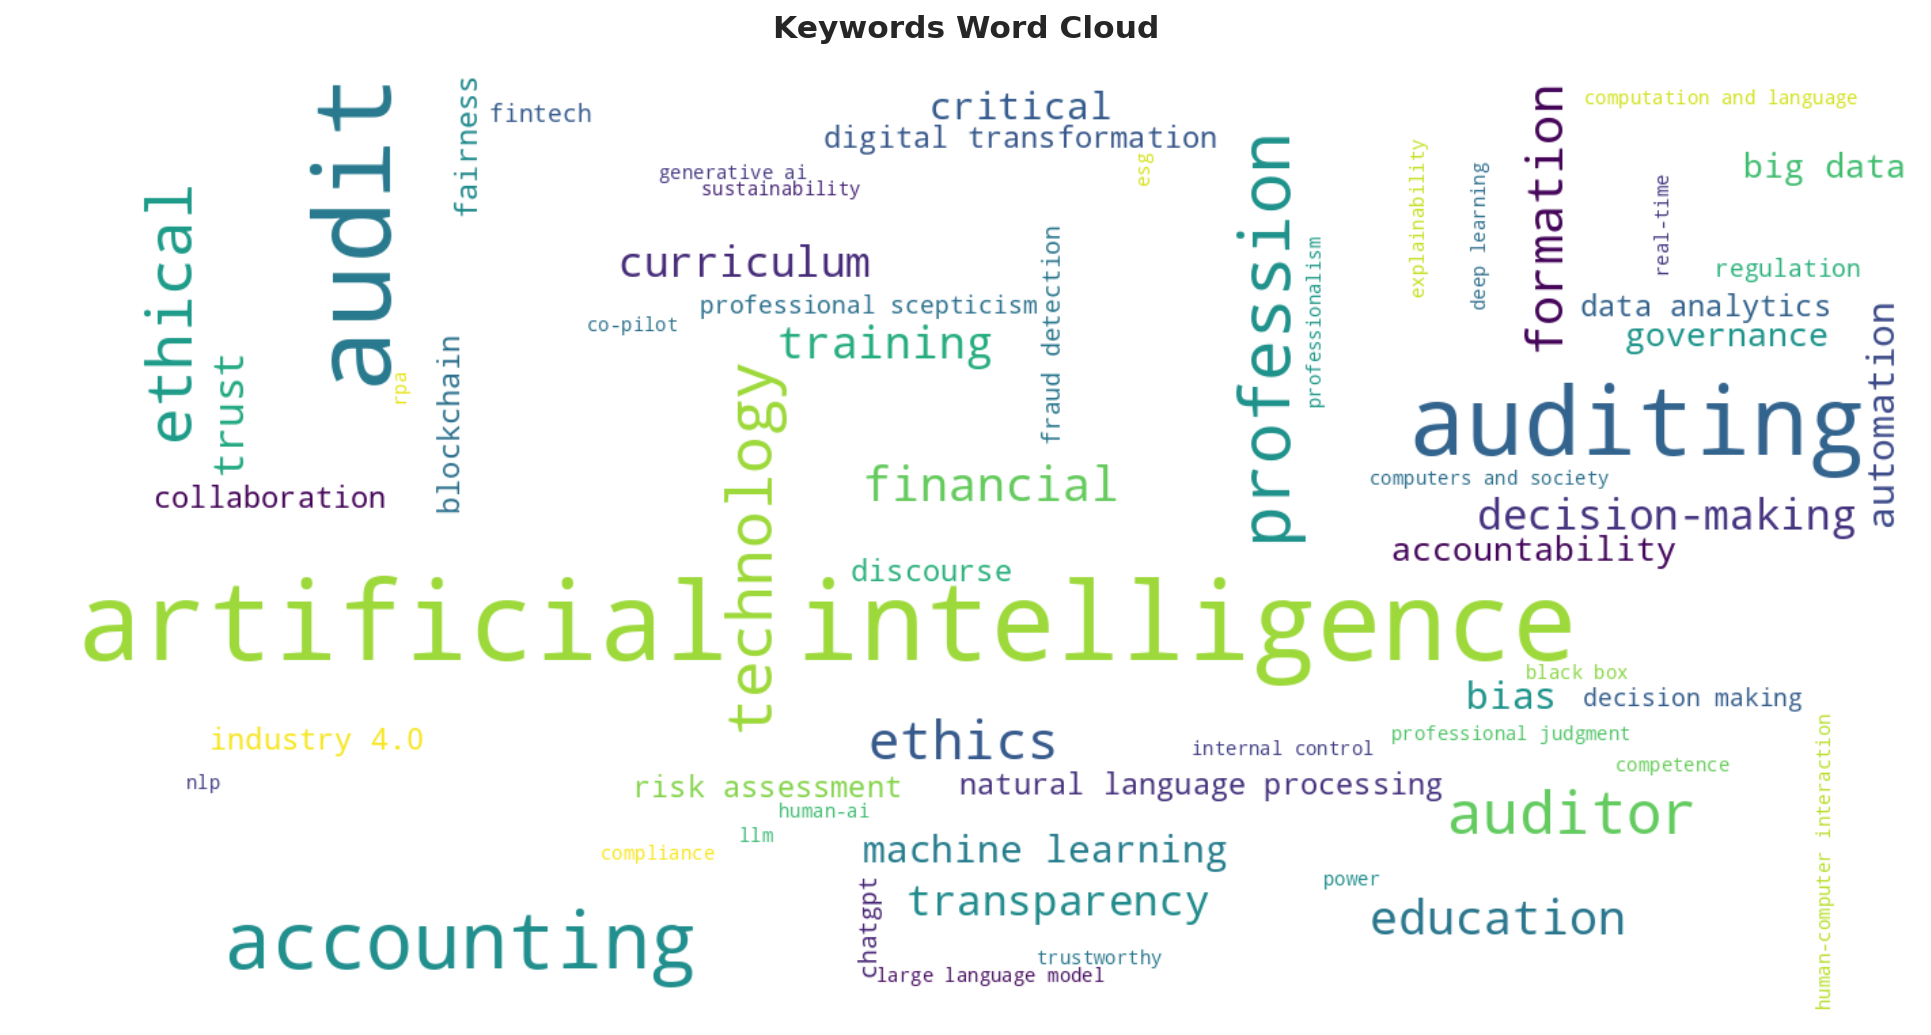 07
07Word Cloud
KeywordsVisual representation of keyword prominence across the entire corpus. Font size is proportional to term frequency.
Download PNG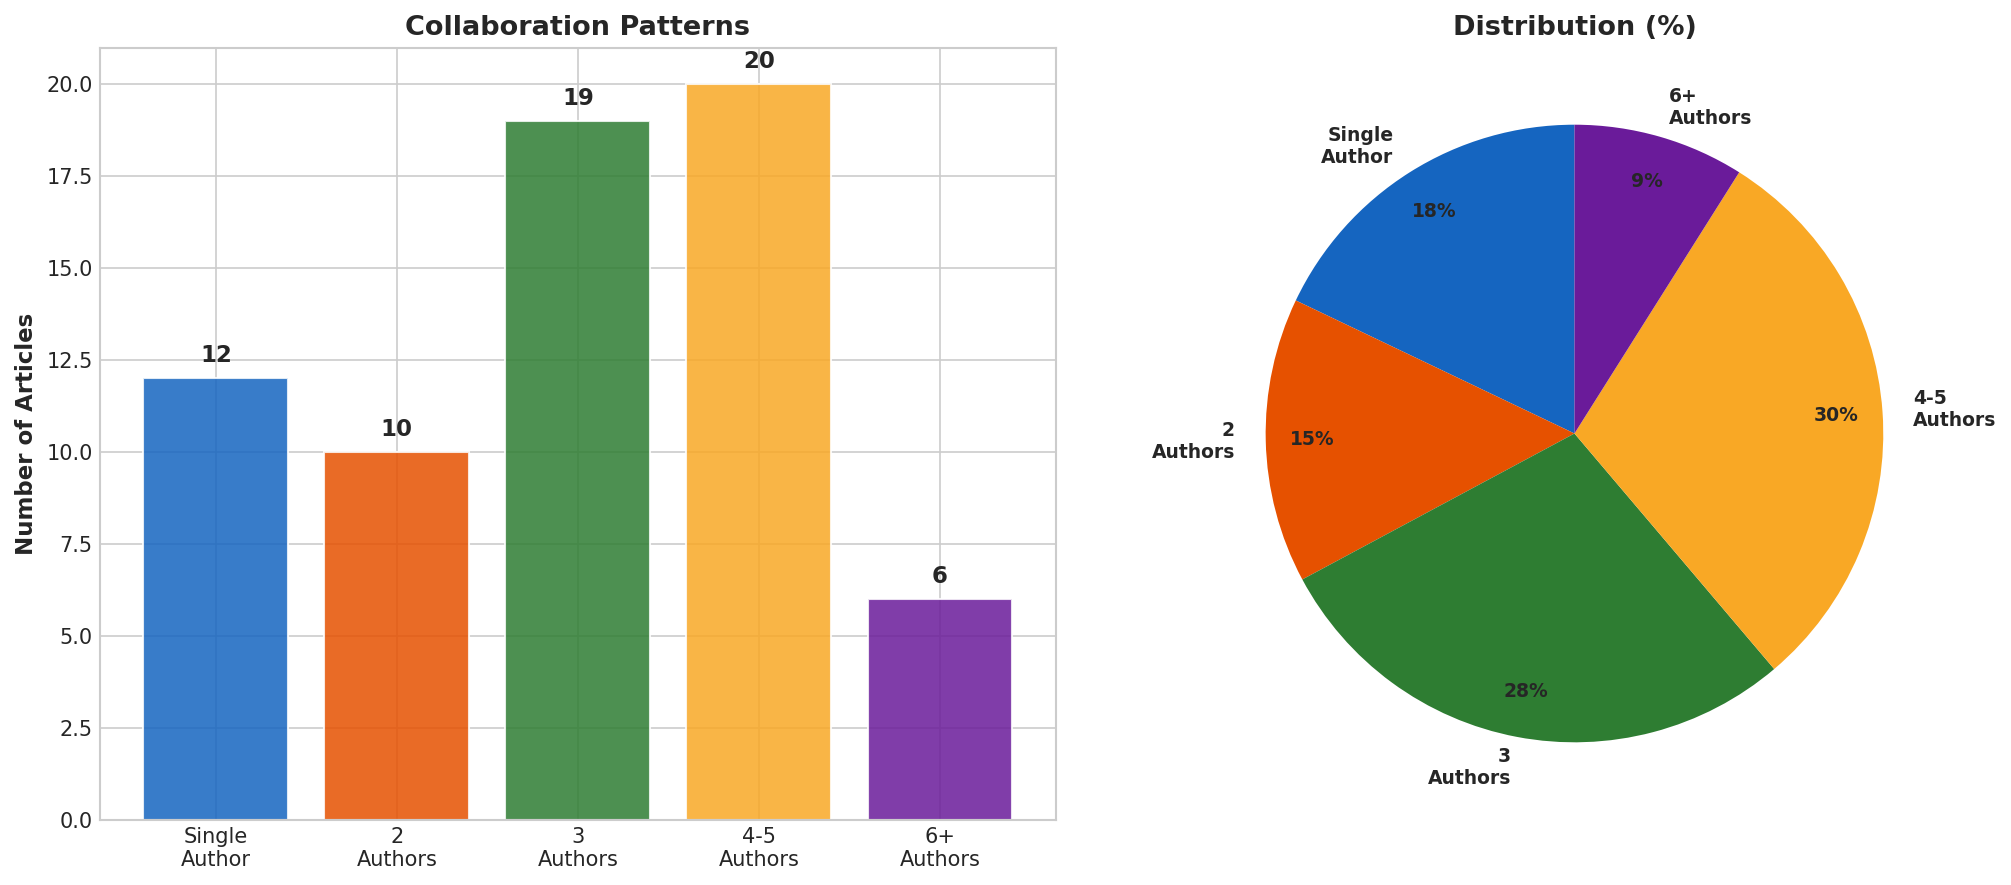 08
08Collaboration Patterns
AuthorshipDistribution of single-authored vs. multi-authored documents, with collaboration index of 3.66 co-authors per article.
Download PNG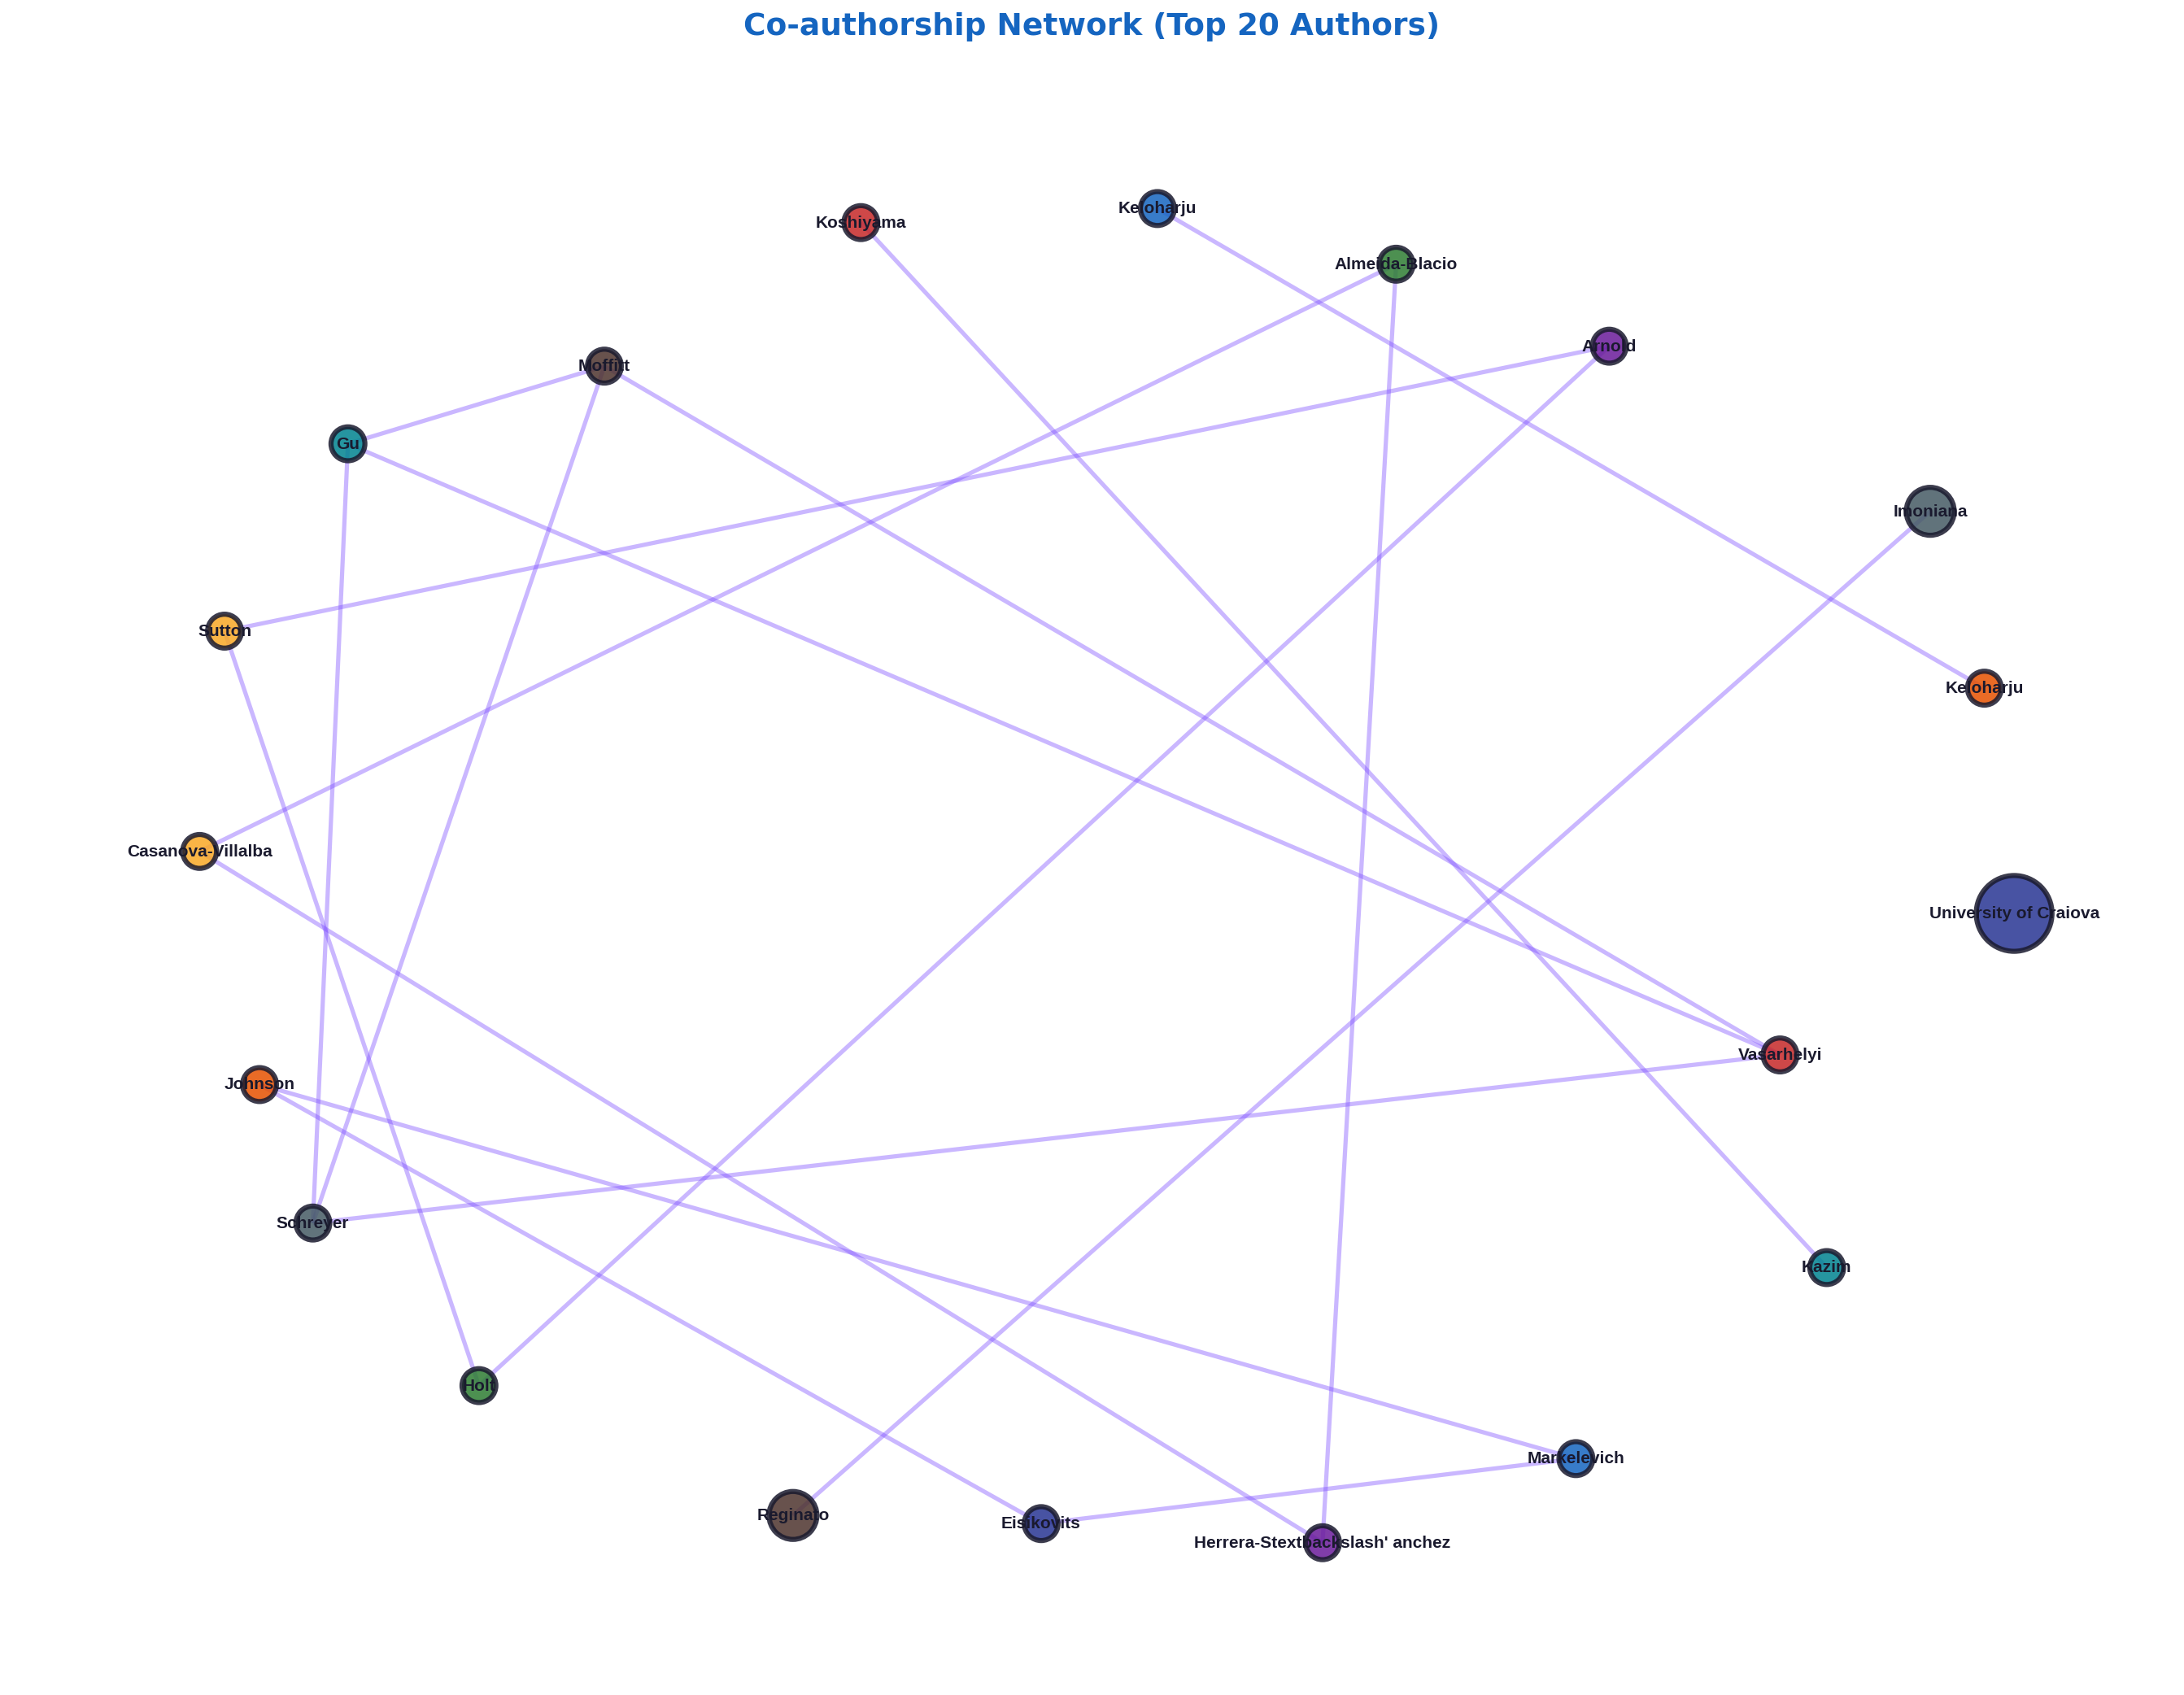 09
09Co-authorship Network — Top 20
NetworkCo-authorship graph for the 20 most connected authors, identifying research clusters and key collaboration hubs.
Download PNG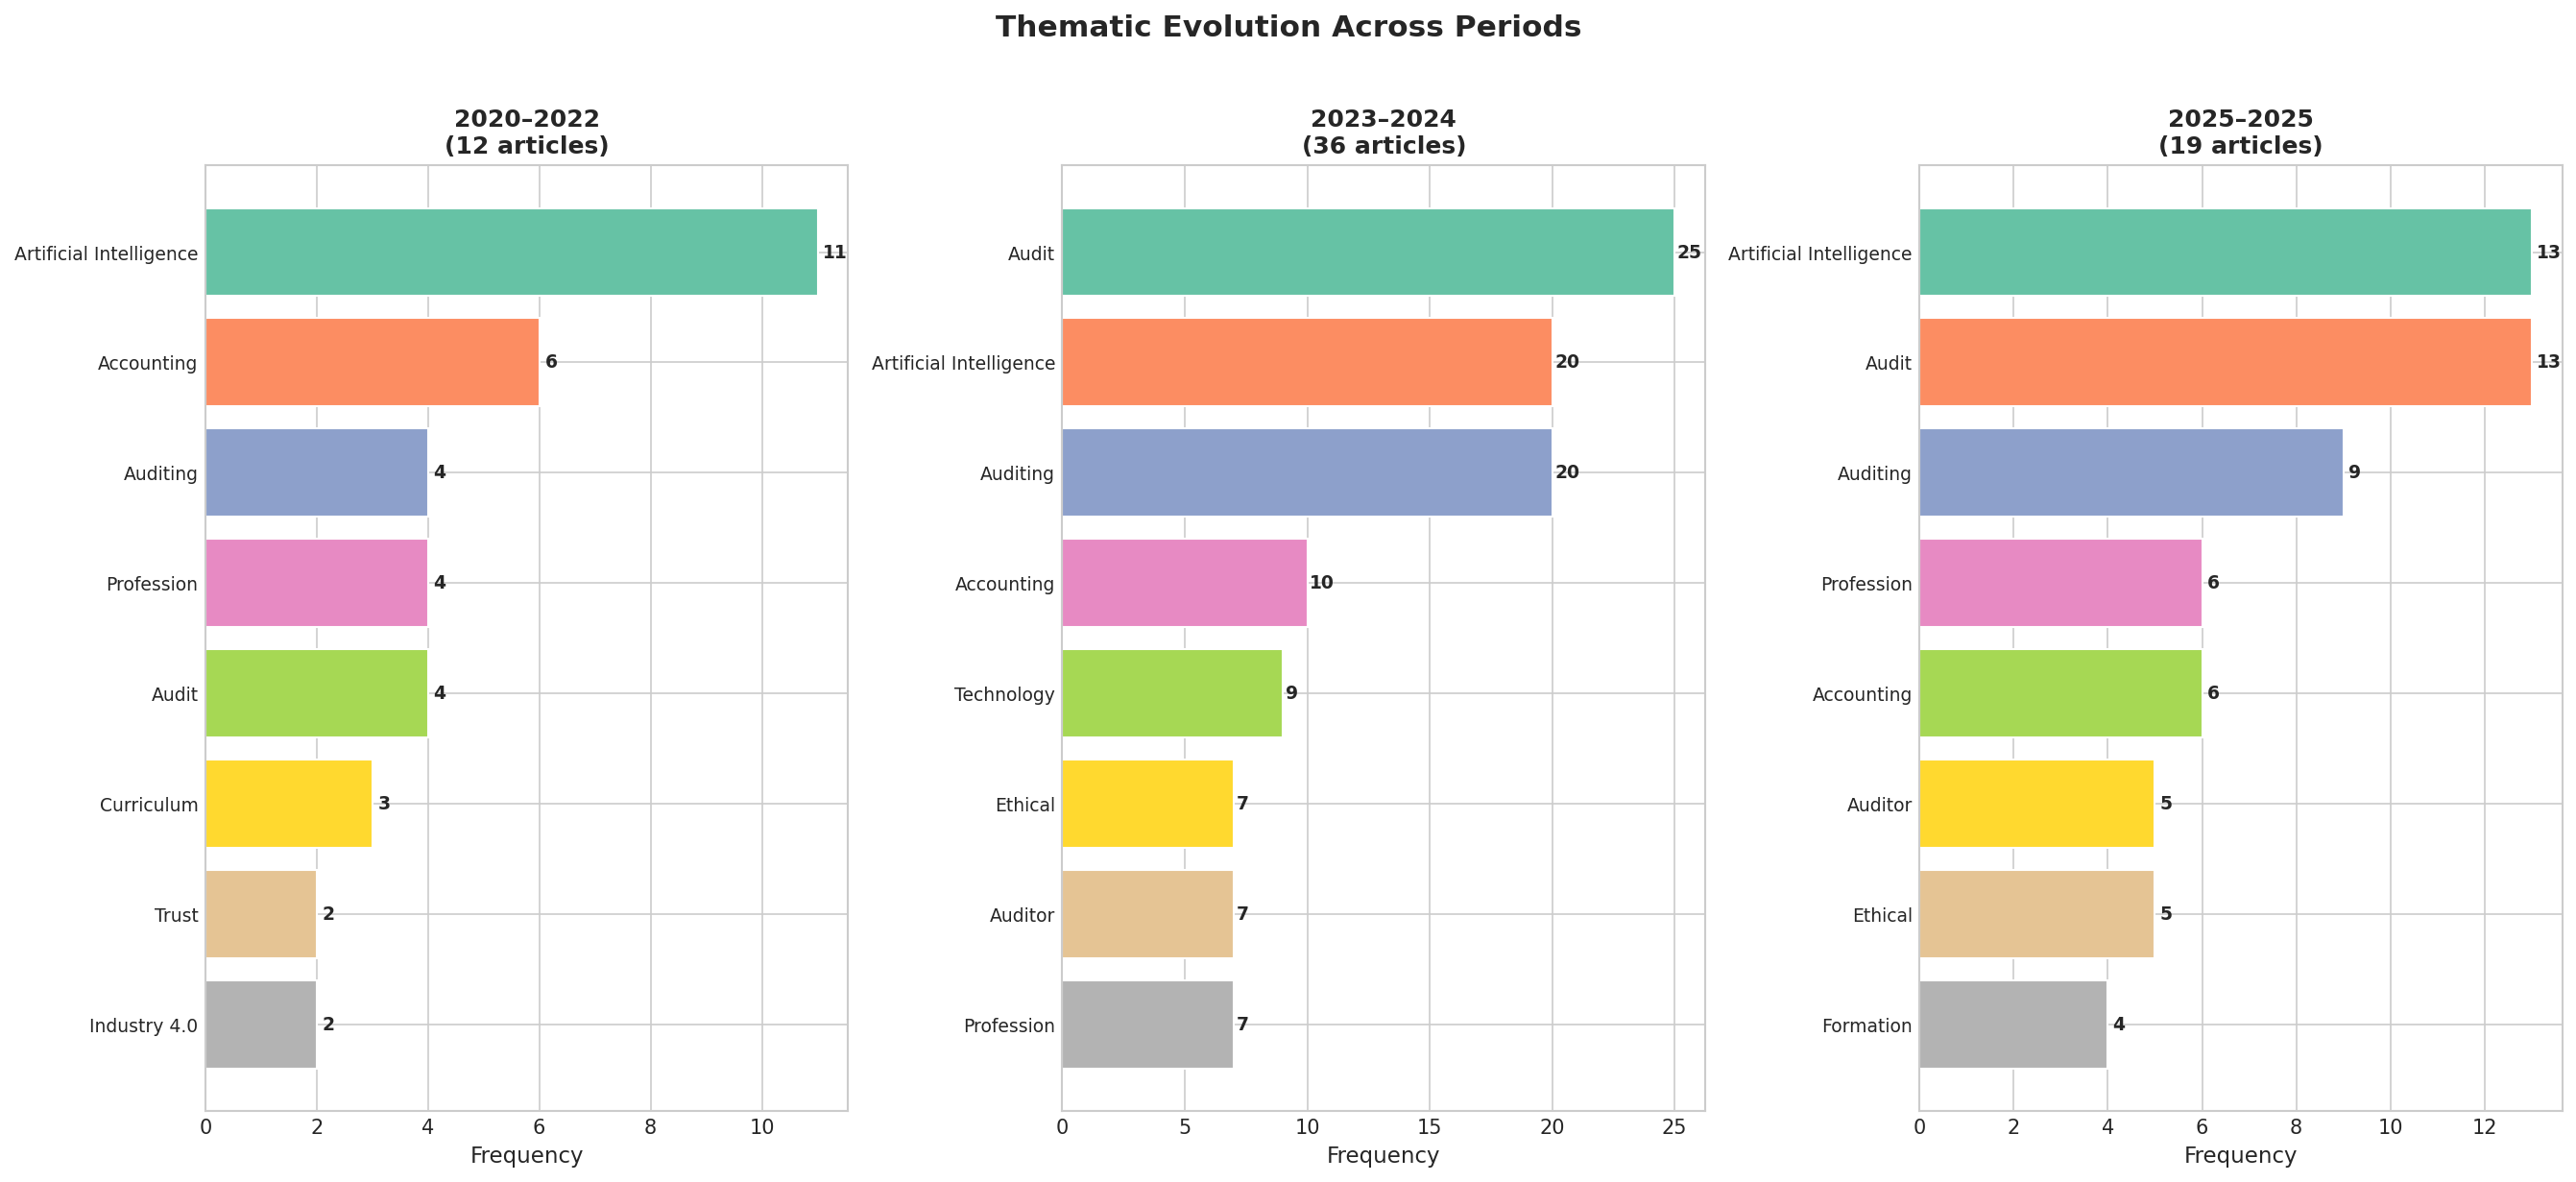 10
10Thematic Evolution Across Periods
ThematicKeyword prominence across three chronological periods, revealing how research themes have shifted over the 2020–2025 span.
Download PNG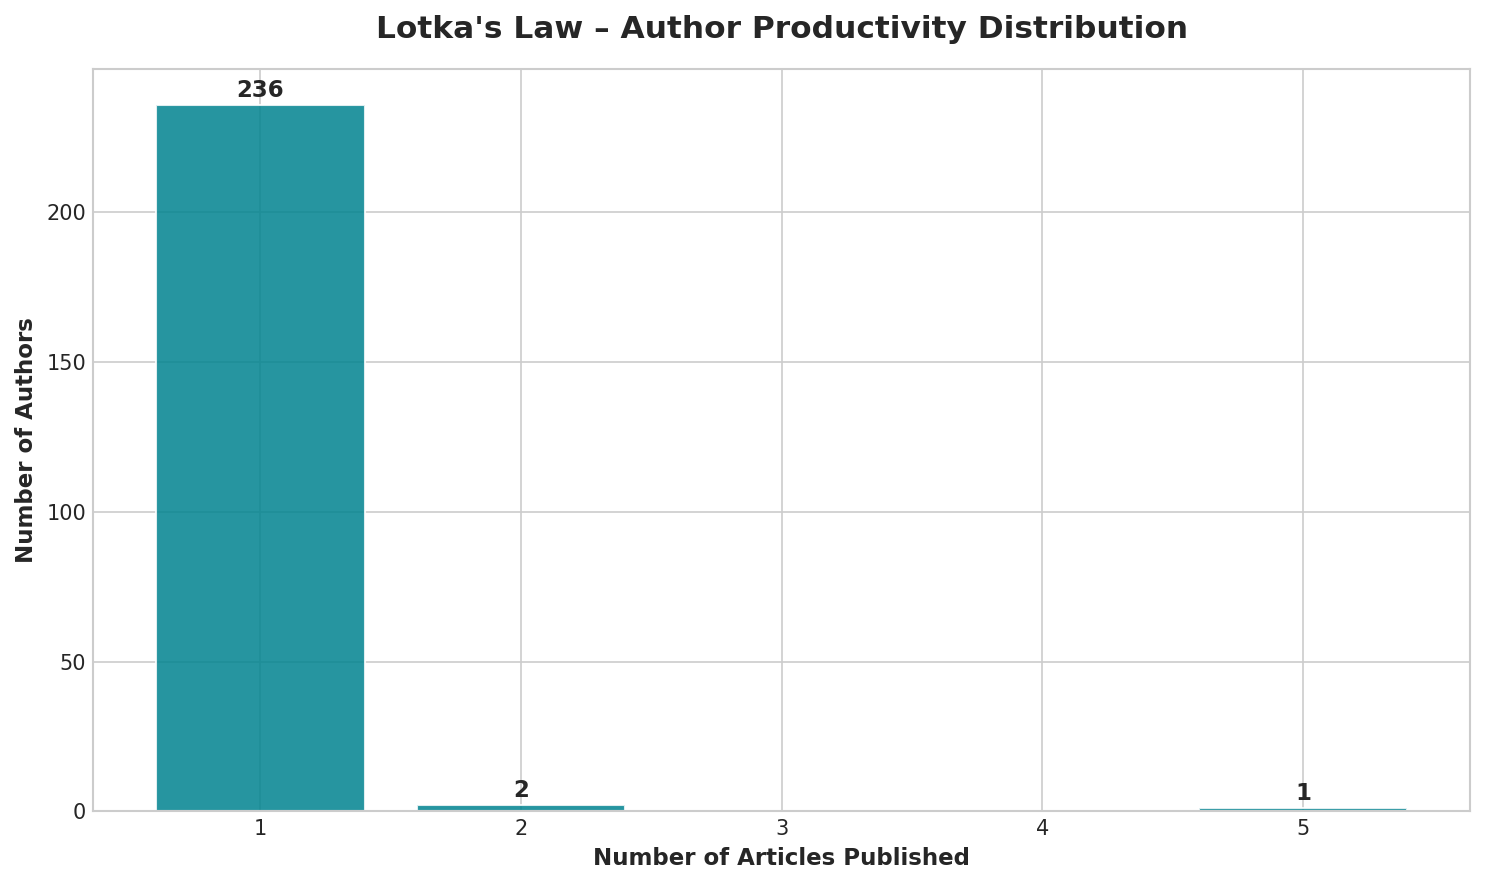 11
11Lotka's Law — Author Productivity
SpecializedObserved vs. expected author productivity distribution under Lotka's inverse-square law, assessing research field maturity.
Download PNG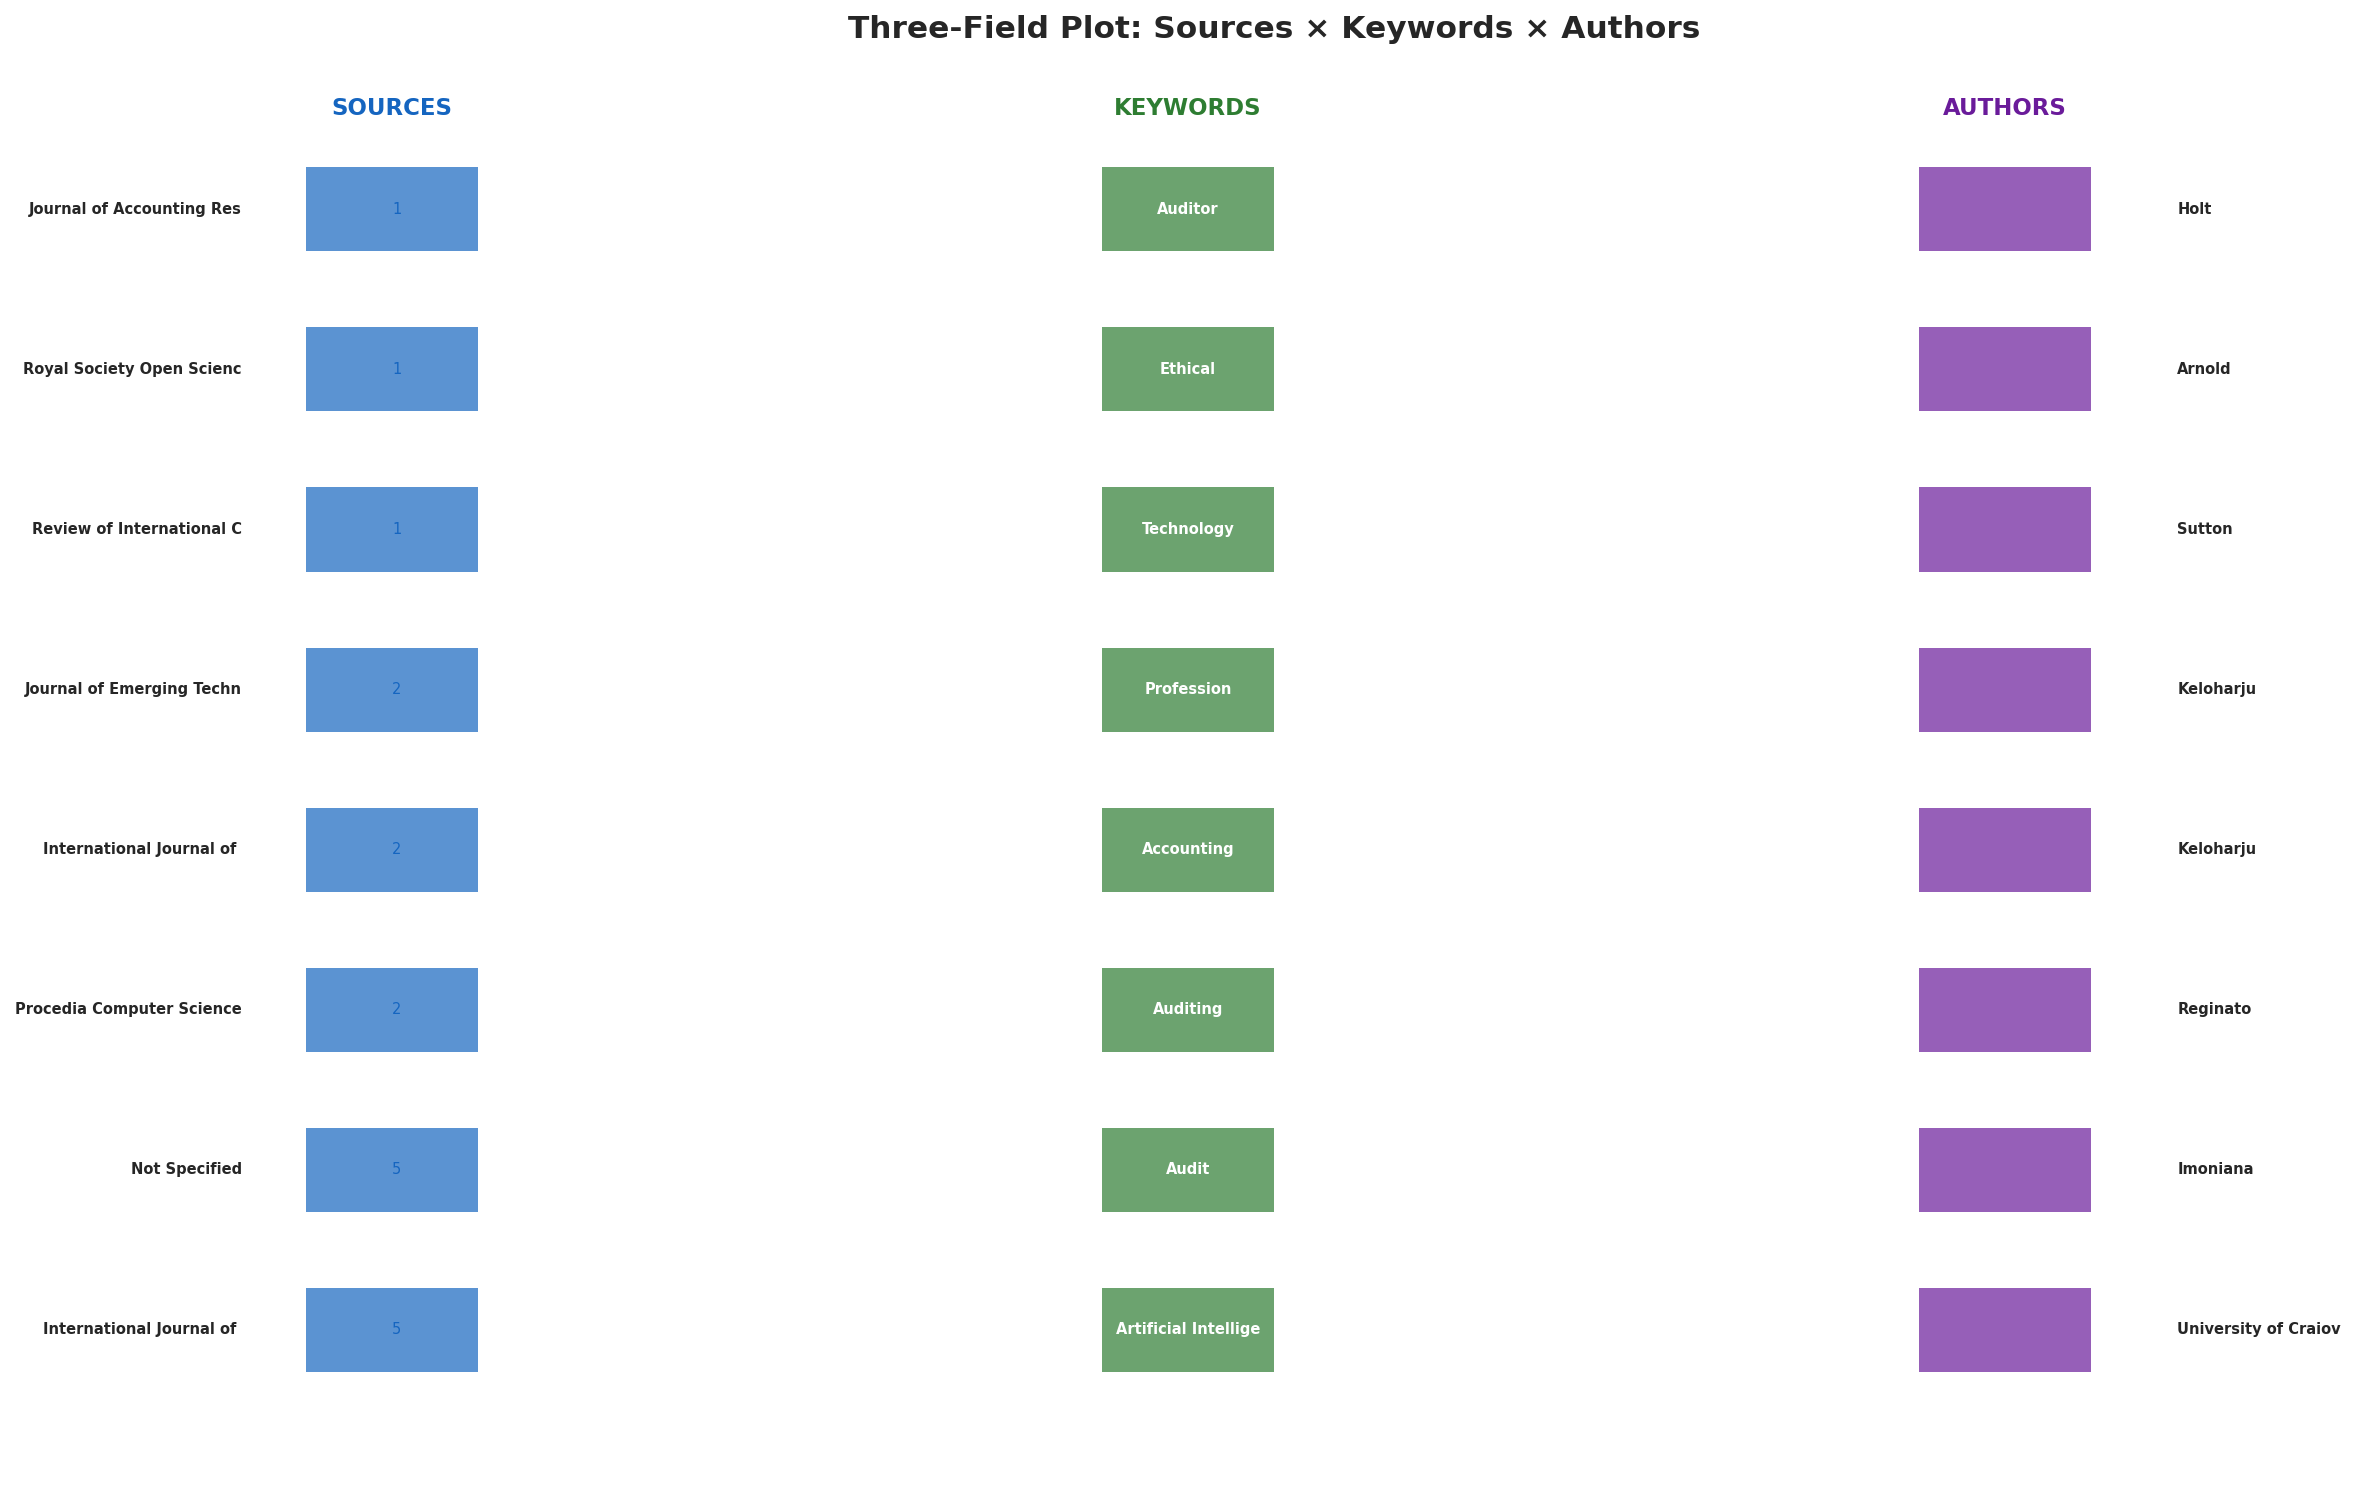 12
12Three-Field Plot (Sources × Keywords × Authors)
NetworkSankey-style diagram linking publication sources, keywords, and authors — revealing structural relationships across the three dimensions.
Download PNGReady to analyze your own corpus?
Upload your .bib file and receive the same 12 charts and 46 metrics in seconds.